Scenario tests are used to compare the output from one or more scenarios. A scenario is composed of:
- An instance: the executable code of the model being tested.
- An input set: a collection of inputs.
- One or more options: a configuration for the run. Also known as parameters or constants.
On top of scenarios, you can configure repetitions, to test for variability in the results.
Scenario tests are generally used as an exploratory test to understand the impacts to business metrics (or KPIs) on situations such as:
- updating a model with a new feature, such as an additional constraint;
- comparing how the same model performs in different conditions, such as low demand vs. high demand;
- doing a sensitivity analysis to understand how the model behaves when changing a parameter.
They can also be used to validate that a model is ready for further testing and likely to make an intended business impact.
To be concise, the test creates a run for each scenario, for all the combinations of repetitions, inputs in the input set, and option sets. For example, imagine you configure these two scenarios:
- Scenario 1: instance
i-1, input sets-1(with 3 inputs) - Scenario 2: instance
i-2, input sets-2(with 2 inputs)
Both scenarios use the same options. If this scenario test was applied 2 repetitions, it would produce the following 15 runs:
| Run # | Instance | Input set | Input ID | Repetition |
|---|---|---|---|---|
| 1 | i-1 | s-1 | input_s-1_1 | 0 |
| 2 | i-1 | s-1 | input_s-1_1 | 1 |
| 3 | i-1 | s-1 | input_s-1_1 | 2 |
| 4 | i-1 | s-1 | input_s-1_2 | 0 |
| 5 | i-1 | s-1 | input_s-1_2 | 1 |
| 6 | i-1 | s-1 | input_s-1_2 | 2 |
| 7 | i-1 | s-1 | input_s-1_3 | 0 |
| 8 | i-1 | s-1 | input_s-1_3 | 1 |
| 9 | i-1 | s-1 | input_s-1_3 | 2 |
| 10 | i-2 | s-2 | input_s-2_1 | 0 |
| 11 | i-2 | s-2 | input_s-2_1 | 1 |
| 12 | i-2 | s-2 | input_s-2_1 | 2 |
| 13 | i-2 | s-2 | input_s-2_2 | 0 |
| 14 | i-2 | s-2 | input_s-2_2 | 1 |
| 15 | i-2 | s-2 | input_s-2_2 | 2 |
Now, consider that you are adding two options to the scenario:
duration: with three possible values of 1, 2, and 3 seconds.iterations: also with three possible values of 32, 35, and 40.
The possible combination of these two options is displayed in the table below:
duration | iterations |
|---|---|
| 1 | 32 |
| 1 | 35 |
| 1 | 40 |
| 2 | 32 |
| 2 | 35 |
| 2 | 40 |
| 3 | 32 |
| 3 | 35 |
| 3 | 40 |
If we apply these 9 combinations to the 15 runs, we will have a total of 135 runs that can be created for a scenario test.
Once the runs are finished, the results are then aggregated and analyzed. The decision model must produce an output that contains a statistics block that uses the statistics convention.
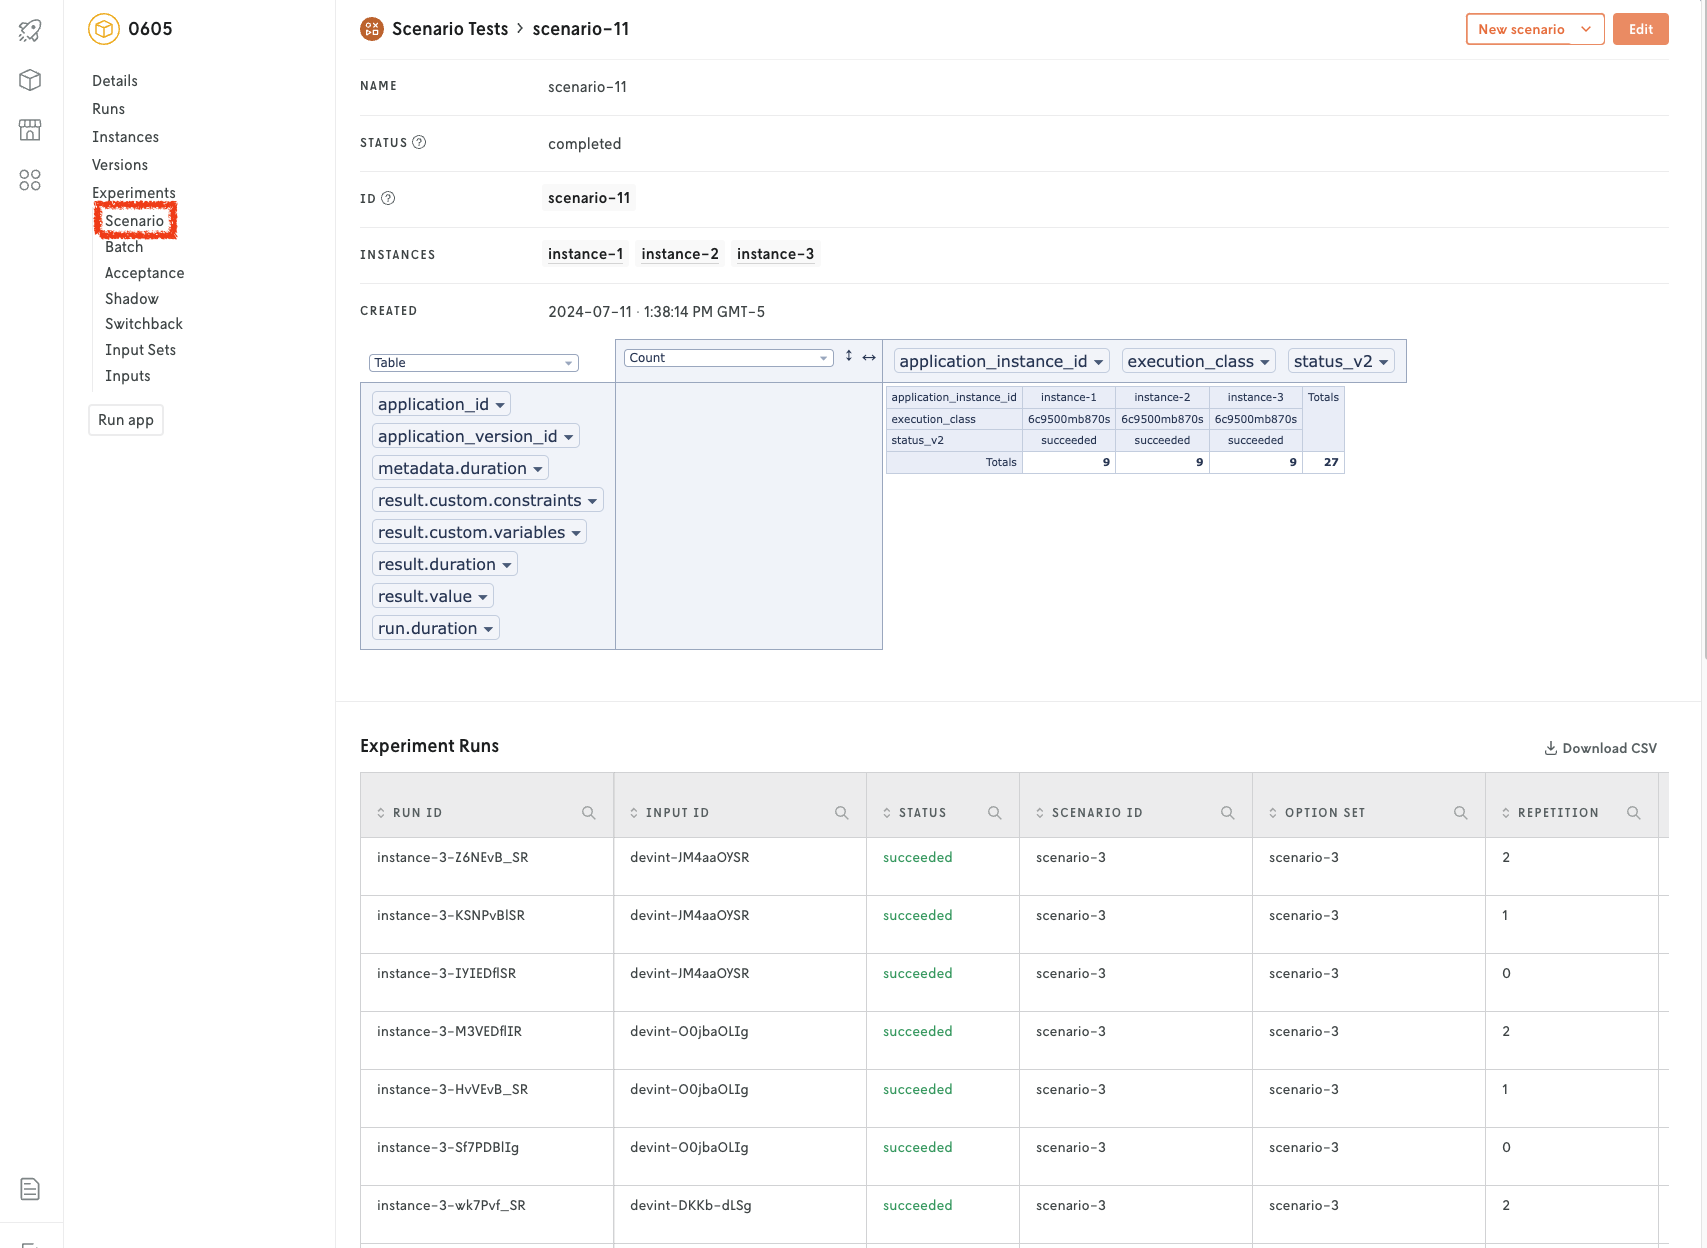
Scenario tests are designed to be started and visualized from the Console web interface. Go to the app, Experiments > Scenario tab.
We highly recommend using the Console for creating and managing scenario tests. However, you can also use these interfaces:
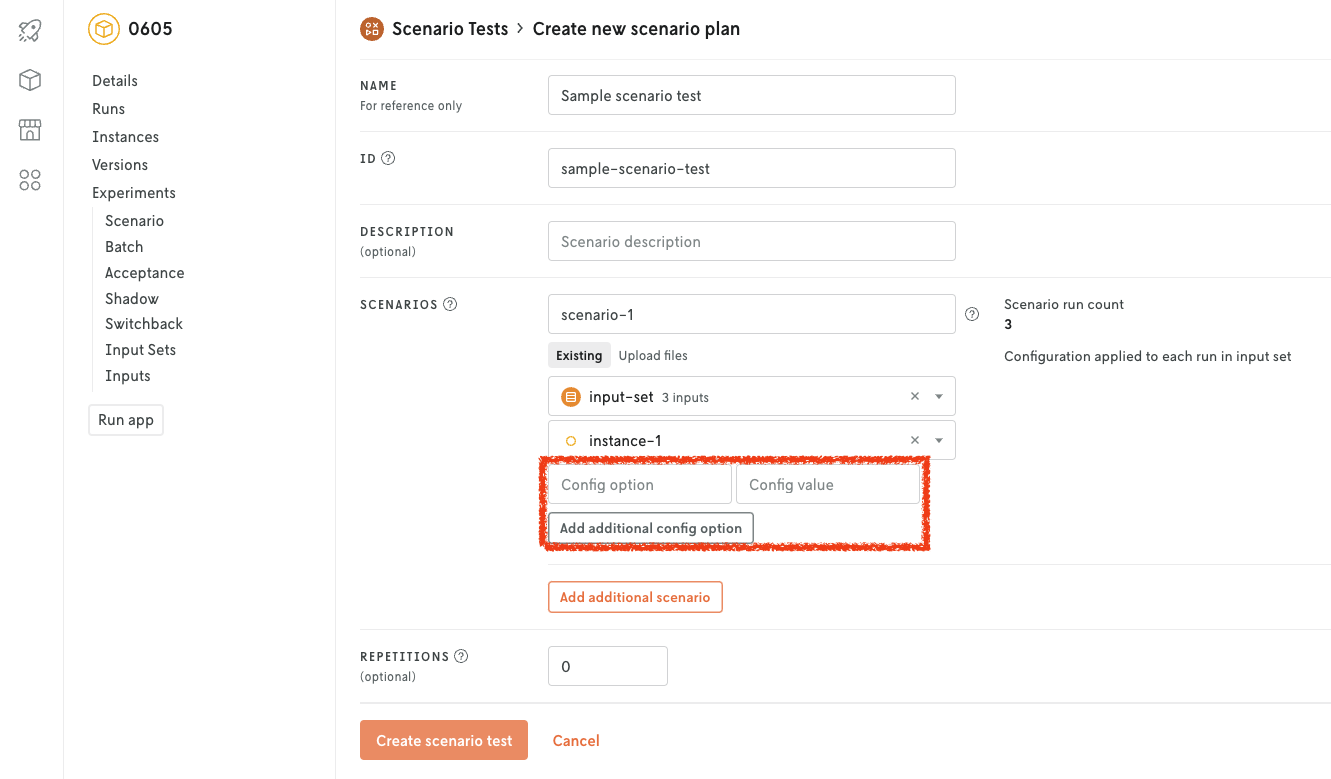
When using the Console, you will see a view similar to the following when creating a new scenario test. Please direct your attention to the configuration of options for the scenario. This is where you can add the different variations of options that will be applied to each run.
Cloud API
Use the following endpoint to create a scenario test. Define the desired experiment ID and name. After, create the scenario test.
Create and start batch experiment.
Create and start batch experiment.
Please take into account the following considerations for the payload:
You don’t need to specify
input_set_idorinstance_ids.The
typemust bescenario.option_setsis a dictionary of objects that specify the different variations of options that will be applied to each run.An option set can be referenced in the
runslist via itsoption_set_id.runsis a list of objects that allows you to specify each run that the scenario test will create. In the example described in a previous section, we addressed how different combinations would result in 135 runs. For that same example, this list would contain 135 objects.This list is created automatically when using the Console. You must always define
runswhen creating a scenario test.The
input_idof a run can be either a previousrun_idor a managedinput_id. A run can specify anoption_setto be used for that run.
Experiment runs
Runs made for the experiment can be retreived with this endpoint.
List batch experiment runs.
List runs used for batch experiment specified by application and batch ID.
This will return the runs of the experiment in the following format:
Where runs is an array that contains the runs made for the experiment. Each run object includes the run metadata plus any summary statistics that were specified in the excecutable binaries used for the experiment (see table below).
Experiment runs must be retrieved independent of the experiment details. However, in Console this run history table can be viewed at the bottom of the experiment details. Each run history item can be clicked to view the details of the run. If the app is a routing app (using either the routing or nextroute template) the run details will also include a visualization of the results.
The run history data can also can be downloaded as a CSV file in Console. Click the Download CSV link in the upper right area of the experiment run history table to download the data as a CSV file.
Note that experiment runs are not shown in your app’s run history.
Delete a scenario test
Deleting a scenario test will also delete all of the associated information such as the udnerlying app runs.
This action is permanent and cannot be undone.
To delete a scenario test, you can use the following interfaces:
Console: use the web interface. Use the
Deletebutton in the scenario test details.Cloud API: use this HTTP endpoint.
DELETEhttps://api.cloud.nextmv.io/v1/applications/{application_id}/experiments/batch/{batch_id}Delete a batch experiment.
Delete a batch experiment specified by application and batch ID.
You will not be prompted to confirm the deletion.