Simplify the collaboration between model developers and end users with DecisionOps. Compare runs, perform scenario tests, create shadow model versions, and share the results with a click.

Subscribe to our newsletter.


We walk through the Nextmv MCP Server's functionality for interacting with Nextmv decision apps via AI agents in a safe, consistent, and reliable way.

How are open source projects being used today? How should the community think about adoption and participation? Hear from members of the Pyomo and HiGHS teams.
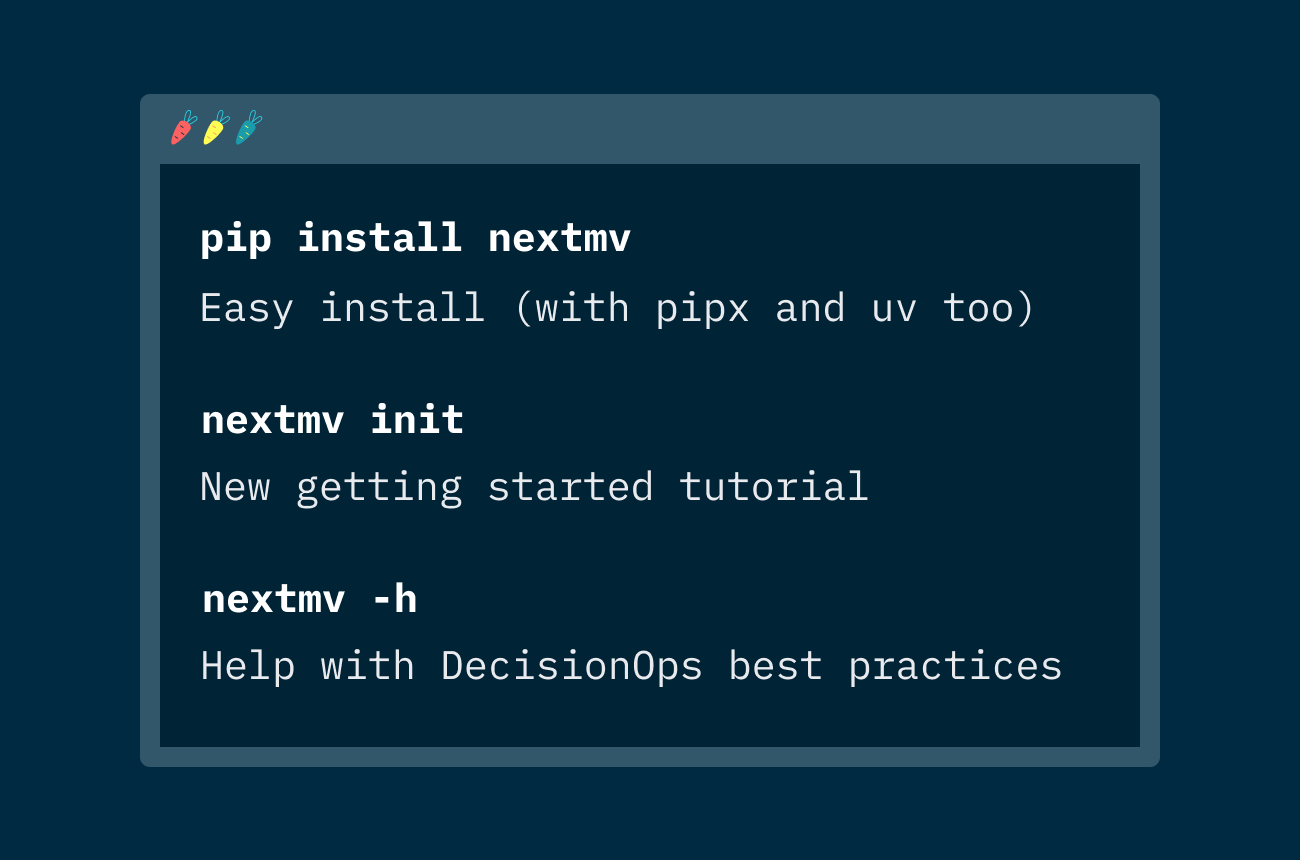
A simple one-line command unlocks everything you need for seamless DecisionOps-powered model development from your local machine to remote infra for testing and production runs.

An overview of approaches for managing model versions for testing, roll out, roll back, and provisioning by geographic region, client, or development environment in the context of DecisionOps.
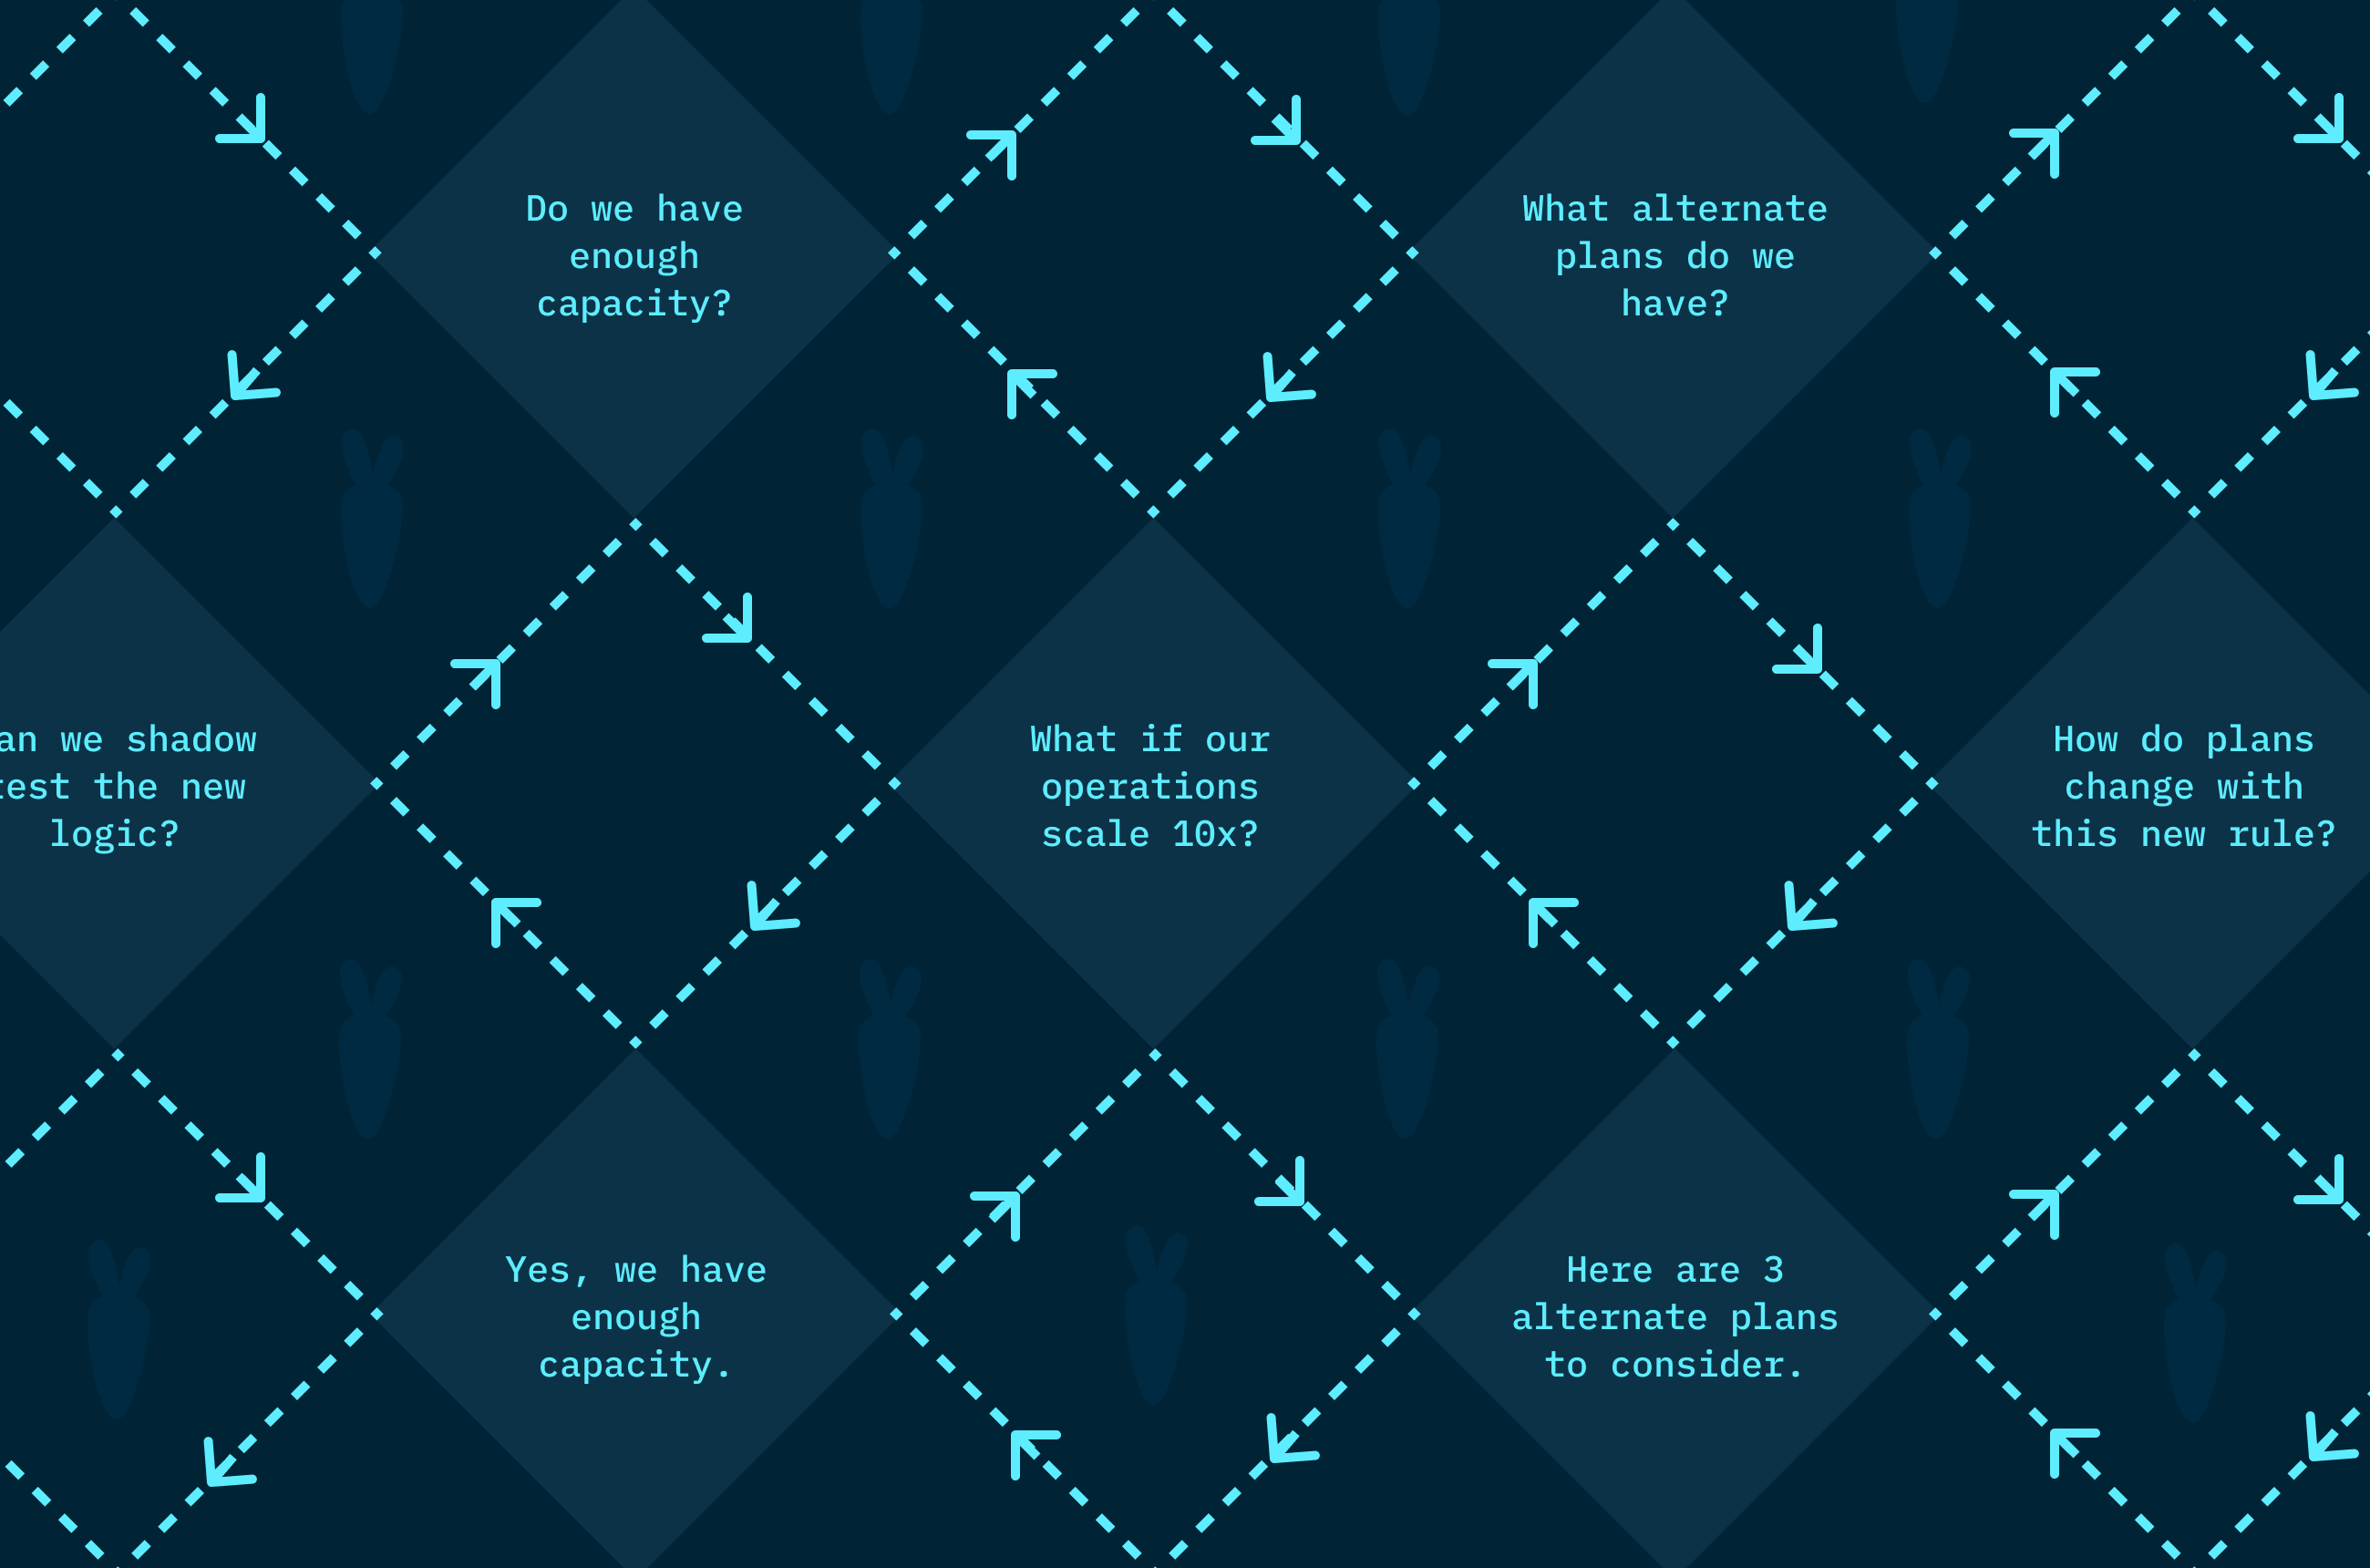
Human review and feedback is part of any good decision workflow. Learn what decision algorithm developers and teams can do to increase trust and build confidence.


